Training Load
Fitness, fatigue, and form, at a glance.
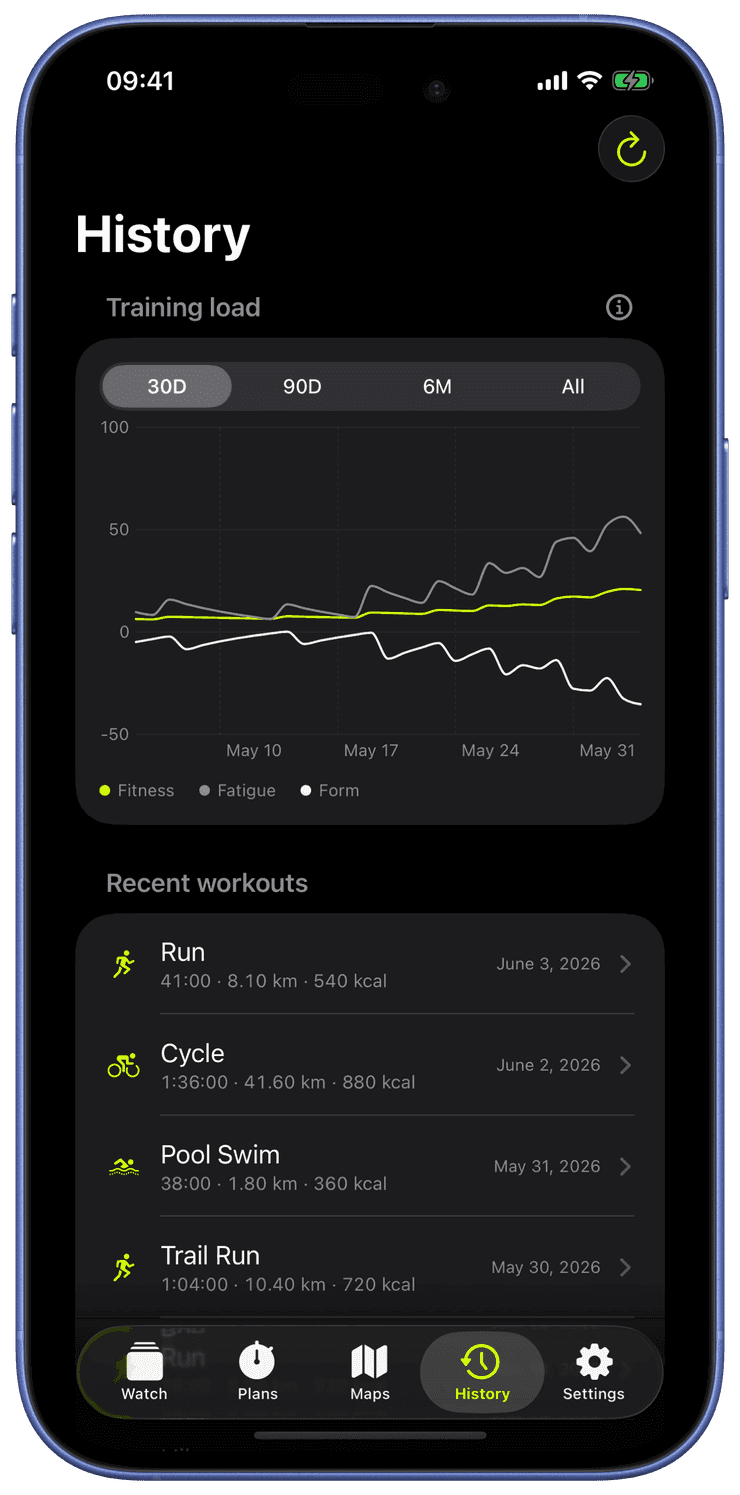
Runara computes a daily training-load chart from your workouts: CTL (a 42-day average, your “fitness”), ATL (a 7-day average, your “fatigue”), and TSB (the balance between them, your “form”).
Sessions are scored with a Banister TRIMP model when heart rate is available, falling back to active energy or duration otherwise. Drag the day cursor to read any point in your build-up, all computed on-device from the workouts already in Apple Health.
Fitness, fatigue, and form
Runara turns months of workouts into one readable picture. Here is the same model the History tab draws. Hover or drag across the chart to read any day.
Hover or drag across the chart to scrub through the block. You can also focus the chart and step through days with the arrow keys.
How it works
Every workout is an impulse
Each session is scored as a training impulse, a Banister TRIMP from your heart rate, or from active energy and duration when heart rate isn't available.
Two moving averages
Fatigue follows the last ~7 days and reacts fast. Fitness follows ~42 days and changes slowly. Train hard and fatigue spikes while fitness inches upward.
Form is the gap
Form is Fitness minus Fatigue. It drops negative while you load, then turns positive as fatigue fades faster than fitness, which is exactly why a taper makes you feel fast.
The fitness–fatigue model
The chart is the Banister impulse-response model from the 1970s: your readiness rises with fitness and falls with fatigue. Because fatigue decays faster than the fitness you built, rest doesn't erase your work. It reveals it as positive form. Runara computes all of this on-device from the workouts already in Apple Health.
τfitness = 42d · τfatigue = 7d